pytest-benchmem
On-demand memory profiling for your benchmarks. Measure how much memory your code actually uses — and see where it goes — on the same benchmarks you already time. For Python libraries and pipelines where memory is a real constraint: large numpy arrays, pandas frames, solvers, C/Cython/Rust extensions. Find the heavy path, fix it, confirm the drop.
It builds on pytest-benchmark. Take an existing test — you don't change it:
@pytest.mark.parametrize("n", [10_000, 100_000, 1_000_000])
def test_sort(benchmark, n):          # your existing pytest-benchmark test, unchanged
    benchmark(sorted, list(range(n, 0, -1)))
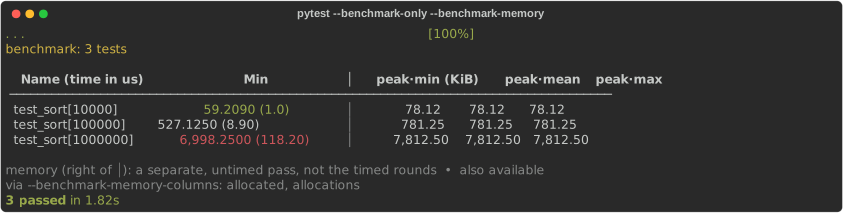
Add one flag, and peak memory appears in pytest-benchmark's own table, after the timing columns. Same test, same run, one JSON file, no second tool:
Find where the memory goes
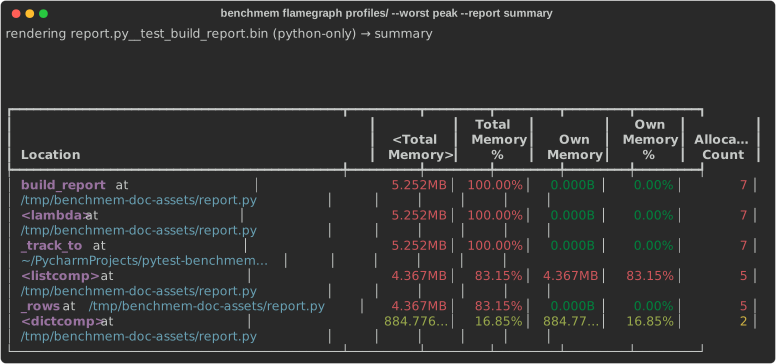
A peak number tells you which benchmark is heavy, not where the memory goes. Keep the memray profile for the offenders and render the allocating call paths — the heart of the tool:
pytest --benchmark-only --benchmark-memory --benchmark-memory-profile profiles/
benchmem flamegraph profiles/ --worst peak --open
The report ranks every frame by the memory it owns — here a single list comprehension in
_rows accounts for 83% of peak:
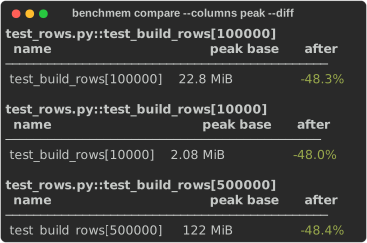
Then change the code, re-run, and diff the two runs to confirm the peak actually dropped (green is a shrink):
Is this for you?
Yes, if you maintain code where memory is a real constraint — large arrays, dataframes, solvers, C/Rust extensions — and you want to find what's heavy, see where it allocates (at allocator precision, not RSS sampling), and confirm a fix, on the benchmarks you already time.
Look elsewhere when you want a whole-test memory limit or leak check rather than a
number on one benchmarked call — that's pytest-memray.
For continuous CI tracking (history, dashboards, PR annotations), reach for
CodSpeed — it runs the same pytest-benchmark benchmark() tests, so one set
of benchmarks serves both. For where it sits against ASV, CodSpeed, and plain memray, see the
README.
Want memory on specific tests only?
--benchmark-memory measures the whole suite. To opt in per test instead, swap
benchmark for the benchmark_memory fixture on just those tests — it's always
measured, and adds a pedantic form for explicit control. See the
Quickstart.
Install
pytest-benchmark and memray are core deps. The memory pass needs memray, which is Linux/macOS only — timing works everywhere.
Where to next
The core loop — measure, find, fix:
| If you want to… | Go to |
|---|---|
| Run your first benchmark and read both metrics | Quickstart |
| Find where the memory actually goes | Find where memory goes |
| Confirm a fix — diff two runs and see what moved | Compare two runs |
| Know which of peak / allocated / allocations / rss to track | Choosing a metric |
| Slice tables and plots by an axis (input size, op, …) | Grouping by dims |
| Look up a specific flag, marker, or function | Reference |
Newer, less battle-tested — feedback welcome:
| If you want to… | Go to |
|---|---|
| Fail CI when memory grows, or cap it at a budget | Catch regressions in CI |
| Chart memory across inputs | Visualize memory |
| Benchmark across installed versions of a package | Compare across versions |
Status
Early. Extracted from the linopy internal benchmark suite, where it's the local memory-profiling layer. The measure → profile → fix loop is the hardened core; the newer features may move before 1.0.