Compare two runs
You changed the code to slim a benchmark down — now confirm it worked. benchmem compare lays
two saved runs side by side, keyed on the benchmark id, so the before/after peak (and whether it
actually dropped) reads at a glance. It's the same view for any two runs — a fix vs. its baseline,
one config against another, a PR against main.
The comparison table
Point it at two --benchmark-json files. By default it shows time and peak across every stat;
narrow with --columns and --stat:
_suite.py::test_build_rows[10000]
                     peak (KiB)
 name                       min
────────────────────────────────
 (baseline)         83.12 (1.0)
 (candidate)   2,131.12 (25.64)

_suite.py::test_build_rows[500000]
                  peak (MiB)
 name                    min
─────────────────────────────
 (baseline)      60.97 (1.0)
 (candidate)   119.97 (1.97)
Each cell carries a relative (N.NN) multiplier vs the column's best run — (1.0) is the best,
larger is worse (in the terminal, best is green and worst red). Rows are grouped into sub-tables by
--group-by (default fullname, so each benchmark's runs sit together and the multiplier reads as
the cross-run ratio). --columns is a comma list of time / peak / allocated / allocations
(a metric absent from every run is dropped); --stat is one of min / max / mean / median /
stddev, or all. --group-by follows pytest-benchmark's grammar (fullname | name | func |
group | module | class | param:NAME, comma-composable).
To fail CI when a cell grows past a threshold, add --fail-on — see
Catch regressions in CI.
One run, two configs — --pivot
Everything above compares run-files. But the file is just the series axis — the thing whose values sit side by side and get the multiplier. The series axis is a dim, and the run-file is only the default one.
--pivot DIM re-points it at a data dim, so a single combined run is A/B'd along that dim.
Say semantics is a param (so it's in the node id, test_build[legacy-100], and a dim):
@pytest.mark.parametrize("semantics", ["legacy", "v1"])
@pytest.mark.parametrize("n", [100, 200])
def test_build(benchmark, semantics, n):
    benchmark(build, semantics=semantics, n=n)
One pytest invocation produces one build.json; --pivot param:semantics folds it so rows that
differ only in semantics pair up (legacy ↔ v1) per n:
Don't confuse it with --group-by, which touches the other axis: --group-by partitions rows
into sub-tables along a dim while the compared series stays the run-files; --pivot makes the dim
itself the compared series, folding rows that differ only in it into one ranked A/B row. In short:
--group-by says which rows belong together; --pivot says what you're comparing. It accepts the
same dims as --group-by (param:NAME or a bare extra_info name) and is mutually exclusive with
multiple runs (an A/B view has one series axis).
A
--pivotparam is lifted out of the id when rows fold (test_build[legacy-100]→test_build[100]), matched by value. A param given a custompytest.param(id=…)whose label differs from its value won't fold — use a plain parametrize value, or anextra_infodim (which isn't in the id at all), for the comparison axis.
The baseline diff — --diff
The default table lays each run out as its own row. For a straight baseline read, --diff collapses
it: metrics move onto the row axis (one row per benchmark × metric) and the columns stay flat —
the baseline value, then a signed Δ% per later run vs it, coloured by direction (red on growth,
green on shrink). The per-run absolute is dropped as redundant (it's base × (1+Δ)), so the table
stays narrow no matter how many metrics or runs. Across a sweep of many runs, the first run is
the baseline and each later run gets its own Δ% column:
name               metric   base      v2       main
test_build[wide]   time     0.0121s   +28.1%   +36.4%
                   peak     58 MiB    +3.4%    +24.1%
test_build[tall]   time     0.0089s    -6.7%    -6.7%
                   peak     41 MiB    -2.4%     -4.9%
With a single metric the metric column is dropped, so a two-run diff is as tight as it gets —
name | peak base | head. It needs at least two series (two or more runs, or one run folded with
--pivot) and defaults --stat to min. It renders in both --format table (colored) and
--format md.
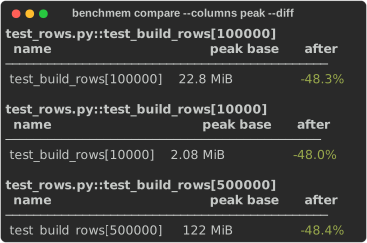
Confirming the list-of-dicts → list-of-tuples fix from Find where memory goes,
the two-run peak diff shows the drop at a glance — each Δ% green because peak shrank:
Order and export
Order rows with --sort (name | value — largest last-run first — | change — biggest growth
first), and write raw numbers for another tool with --csv:
Sharing the table
For a readable artifact rather than the terminal view, you have three paths:
benchmem compare base.json head.json --format md      # GitHub-flavored markdown to stdout
benchmem compare base.json head.json > out.txt        # plain monospace table (rich drops colour)
benchmem compare base.json head.json --csv out.csv    # raw unscaled values for another tool
--format md is the one to pipe into a PR comment or $GITHUB_STEP_SUMMARY — it renders as a
native table on GitHub. It drops the terminal's best-green/worst-red colour (GFM strips inline
styles), but the (N.NN) multiplier already carries it. A plain > out.txt redirect is enough when
you just need a monospace block to paste in ``` fences.
Where to go next
- Fail CI when a number grows → Catch regressions in CI
- See the same data as an interactive chart → Visualize memory
- Which metric to compare on → Choosing a metric